Chapter 01
The Invisible Drain: Macro Economics of Indian Industrial Freight
In enterprise Indian manufacturing - spanning steel mills, cement plants, mining concessions, chemical refineries, and heavy engineering facilities - logistics is frequently treated as a simple procurement exercise. Sourcing heads negotiate aggressively over freight rates, battling across quarterly tenders to shave ₹30 per tonne or ₹1.50 per kilometre off transporter bids. Yet, when CFOs review the annual financial statements, total logistics spend remains stubbornly high, consuming between 6% and 14% of gross revenue.
The reason for this persistent gap is straightforward: base freight rates represent only 30% to 40% of the true Total Cost of Logistics (TCL). The remaining 60% to 70% of logistics capital drains away invisibly beneath the surface. It leaks through chaotic plant gate detention, uncalibrated weighbridge shrinkage, in-transit inventory holding costs, unmonitored spot market surge rates, and 45-day paper invoice audit disputes.
Managing heavy industrial logistics by looking only at base freight rates is like steering a vessel by looking only at the tip of an iceberg. To protect operating margins, enterprise supply chain leaders must measure, control, and plug every hidden seam across the physical and digital supply chain.
- Base freight rate · 35%
- Gate detention & yard wait · 22%
- Weighbridge shrinkage & overload · 16%
- In-transit capital & buffer stock · 15%
- Manual audit & invoice leaks · 12%
Heavy manufacturing enterprise data (Steel, Cement, Mining, Chemicals). Direct freight rate is only 35% of total logistics expense.
Procurement metric
Traditional freight rate focus
Lowest base quote (INR/tonne or INR/km)Total Cost of Logistics (TCL) model
Total landed cost including dwell, shrinkage, and capitalPlant gate dwell
Traditional freight rate focus
Ignored at booking; disputed on detention billsTotal Cost of Logistics (TCL) model
Measured per truck stage; capped under 120 minutesWeighment variance
Traditional freight rate focus
Accepted as unavoidable scale tolerance (1-2%)Total Cost of Logistics (TCL) model
Direct scale serial lock; automated tolerance flags (<0.5%)Transit tracking
Traditional freight rate focus
Basic driver phone calls or standalone GPS pinTotal Cost of Logistics (TCL) model
Tri-hybrid GPS + FASTag toll timestamps + SIM triangulationDelivery proof
Traditional freight rate focus
Physical paper LR returned in 30 to 60 daysTotal Cost of Logistics (TCL) model
Instant digital ePOD with geo-stamped signature and photoInvoice processing
Traditional freight rate focus
Manual spreadsheet checks; delayed payment cyclesTotal Cost of Logistics (TCL) model
Automated 4-way match (PO + Gate + Scale + ePOD) in 48 hrsOperational comparison for industrial plant heads, CFOs, and supply chain directors.
Total Cost of Logistics (TCL) Equation
TCL = Base Freight Rate + Gate Detention Penalties + Weighbridge Variance & Shrinkage + In-Transit Working Capital Drag + Invoice Leakage & Billing Overcharges.
In-Transit Capital Holding Cost Formula
Daily In-Transit Capital Cost = Consignment Value (INR) * (WACC % / 365) * Transit Delay (Days).
Worked Financial Case: Steel Coil Consignment
A heavy flatbed carrying specialized cold-rolled steel coils valued at ₹5,00,00,000 (₹5 Crores) with an enterprise WACC of 12% incurs ₹16,438 per day in working capital interest drag. A 4-day unmonitored highway delay locks up ₹65,752 in pure financing waste on a single truckload.
Financial impact models for heavy industrial enterprises (Steel, Cement, Mining, Chemicals, Capital Goods).
01
Fixed Costs: ₹1,10,000 - ₹1,30,000 / Month
Vehicle loan EMI (₹55k - ₹65k), driver/helper salaries and trip allowance (₹44k - ₹58k), commercial insurance, national permits, and fitness certification (₹30k - ₹32k). Fixed costs tick 24/7 even when idling at plant gates.
02
Variable Costs: ₹26 - ₹37 / Kilometre
Diesel fuel (45% - 50% of variable spend, i.e., ₹19 - ₹24/km), NHAI FASTag electronic tolls (₹3 - ₹7/km), tyre wear and scheduled preventive maintenance (₹3.50 - ₹5.50/km).
03
The Idling Penalty Dynamic
When trucks sit idle inside plant gates for 8 hours, transporters earn zero variable revenue while fixed amortisation continues. Transporters recover this loss by inflating subsequent spot quotes or billing punitive detention.
Operational cost benchmarks explaining why idle truck standing triggers aggressive carrier detention claims.
The Total Cost of Logistics (TCL) Framework
To capture the full economic footprint of industrial transportation, enterprise supply chain teams must replace single-rate procurement with the comprehensive Total Cost of Logistics equation:
Total Cost of Logistics (TCL) = Base Freight Rate + Gate Detention Penalties + Weighbridge Variance & Shrinkage + In-Transit Working Capital Drag + Invoice Leakage & Billing Overcharges.
When an enterprise measures all five parameters simultaneously, a transporter offering a ₹50/tonne discount on paper often turns out to be significantly more expensive in reality if their trucks arrive unannounced, trigger 5 hours of gate congestion, experience transit delays, or submit disputed invoices months after delivery.
The Working Capital Drag of In-Transit Delays
In heavy manufacturing, the value of cargo sitting on the highway is substantial. A single 49-tonne trailer loaded with prime hot-rolled steel coils, specialized chemicals, or precision machinery easily carries between ₹30 Lakhs and ₹5 Crores in inventory value.
Every day a truck sits idle in an unauthorized highway dhaba stop, breaks down without backup, or waits outside a customer warehouse, the enterprise absorbs a direct working capital interest cost calculated as: In-Transit Capital Cost = Consignment Value (INR) * (WACC % / 365) * Delay Days.
For a manufacturing enterprise with a Weighted Average Cost of Capital (WACC) of 12%, holding ₹100 Crores of industrial finished goods in transit for an extra 3 days across unmonitored highway corridors burns ₹9,86,301 in pure financing cost every month - entirely separate from direct freight charges.
The Fixed and Variable Economics of Long-Haul Trucking
Understanding cost leakage also requires understanding the financial reality of the truck operator. A standard 32ft Multi-Axle Vehicle (MXL) or 49-tonne heavy trailer in India operates under fixed monthly costs of ₹1,10,000 to ₹1,30,000 (comprising vehicle loan EMIs of ₹55,000 to ₹65,000, driver/helper salaries and trip allowances of ₹44,000 to ₹58,000, plus insurance, permits, and fitness amortisation).
These fixed costs run 24 hours a day, 365 days a year. When a truck sits idle inside a manufacturing plant yard for 6 hours waiting for a loading bay, the transporter loses billable operating hours. To compensate, transporters bake buffer premiums into subsequent contract bids or demand inflated detention charges. Variable operating costs (diesel at ₹19 to ₹24 per km, FASTag tolls at ₹3 to ₹7 per km, and tyre wear at ₹3.50 to ₹5.50 per km) only generate revenue when the vehicle is moving. That toll band is a workshop, not a plaza tariff. The FASTag and barrier-free tolling guide shows what a live gantry changes, and what it does not. Fast yard turnaround benefits both shipper and carrier.
Chapter 02
Leak #1: Plant Gate Turnaround Time (TAT) and Yard Demurrage
The first and most immediate cost leak occurs directly at the factory gate. In typical unorganized manufacturing operations, hundreds of heavy trucks arrive at the plant boundary each morning without prior appointment scheduling. Drivers park along access roads, creating kilometers of congestion, blocking incoming raw material flow, and overwhelming plant security.
Inside the boundary, gatekeepers record vehicle numbers and driver details in paper logbooks, weighbridge operators manually type tare weights into standalone computers, and drivers wander on foot through massive production yards searching for available loading bays or crane operators. This operational friction inflates plant Turnaround Time (TAT) to 6, 8, or even 14 hours per vehicle.
Under standard Indian commercial logistics contracts, shippers grant 2 to 4 hours of free time for loading or unloading. The moment the clock crosses minute 241, detention penalties kick in. For rigid multi-axle trucks, detention runs ₹500 to ₹700 per hour; for 49-tonne trailers, pneumatic bulkers, and heavy tippers, rates reach ₹800 to ₹1,000+ per hour.
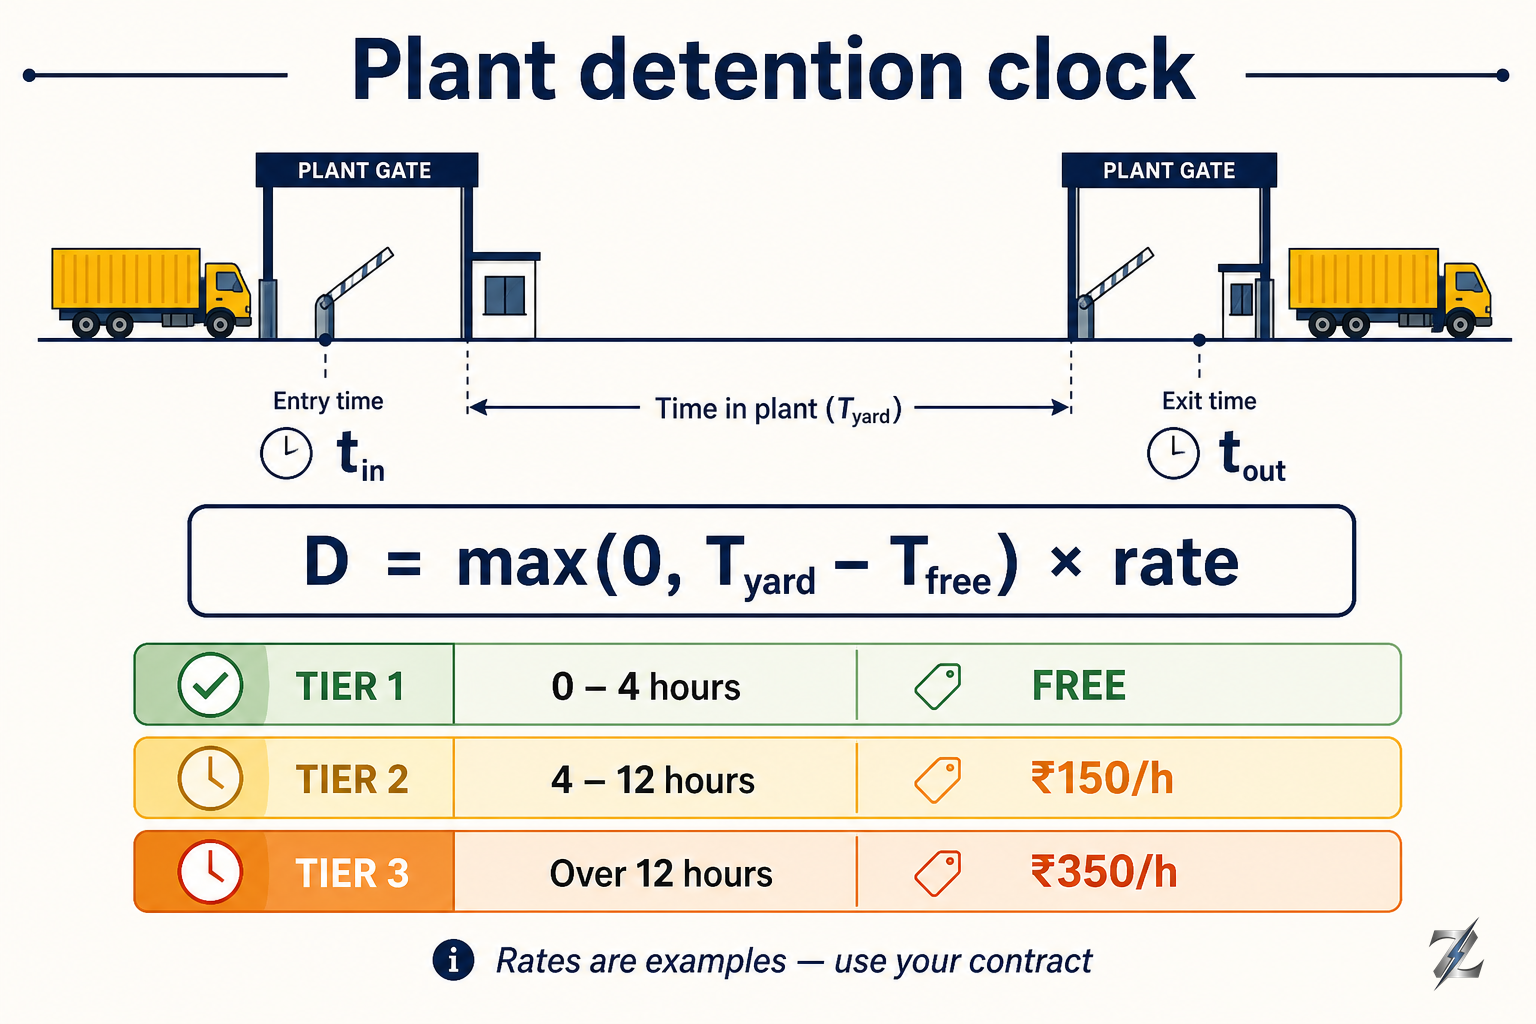
Commercial calculation: Detention Cost = Max(0, Total Plant Dwell Hours - Contract Free Time) * Hourly Vehicle Class Rate.
01
1. Outer Gate In
ANPR camera reads number plate; FASTag verifies RFID tag; matches open ERP dispatch order; boom barrier opens.
02
2. Tare Weighment
Truck rolls onto weighbridge; optical beams verify positioning; indicator locks unladen weight via RS-232 serial feed.
03
3. Bay Allocation
System checks loading bay availability; sends SMS/WhatsApp to driver with assigned bay number; digital screen directs traffic.
04
4. Gross Weighment
Loaded truck returns to scale; system calculates net payload; verifies against MoRTH axle cap and ERP invoice quantity.
05
5. Digital Gate Out
e-Way Bill Part B automatically confirmed; digital gate pass generated; barrier lifts; exit timestamp recorded.
How modern plant TMS eliminates truck queues and tracks real dwell time across the plant boundary.
Stage 1: Gate Entry
Manual process risk
Manual paper register; 15-25 min queue per vehicleAutomated TMS solution
FASTag / ANPR instant scan; ERP order checkStage 2: Tare Weighment
Manual process risk
Operator types tare weight; vulnerability to scale fraudAutomated TMS solution
Serial port scale lock; auto-records unladen massStage 3: Bay Loading
Manual process risk
Drivers wander looking for bays; loading bottlenecksAutomated TMS solution
Automated SMS/WhatsApp bay allocation & digital displayStage 4: Gross Weighment
Manual process risk
Overloading past MoRTH limits; highway RTO finesAutomated TMS solution
Automated scale lock + ERP tolerance threshold checkStage 5: Gate Exit
Manual process risk
Manual invoice checking; lost physical gate passesAutomated TMS solution
Automated digital gate pass and real-time e-Way syncOperational risks of manual paper registers vs automated TMS yard management.
- 14ft / 20ft Rigid LCV350 ₹/hr
- 32ft Multi-Axle Vehicle (MXL)600 ₹/hr
- 40ft Flatbed Trailer (40T/49T)850 ₹/hr
- 55T Heavy Bulker / Tipper1000 ₹/hr
Indian freight market commercial contract benchmarks. Dwell billing starts after 2 to 4 hours free time.
200 Outbound Trips Monthly Scenario
A plant dispatching 200 outbound trips per month with an average 2-hour detention overrun past free time at ₹500/hr incurs ₹2,00,000 monthly in pure detention penalties (₹24 Lakhs/year).
Factory Throughput Bottleneck
Gate congestion creates floor stockouts in finished goods storage, forcing upstream production lines to throttle output while trucks miss evening highway departure windows.
Demurrage loss calculation for medium-to-large manufacturing facilities.
The Financial Drain of Gate Queues
Consider a medium-sized manufacturing facility dispatching 200 outbound truckloads per month. If poor bay coordination and paper gate entries cause an average dwell overrun of just 2 hours past contract free time at ₹500 per hour, the enterprise incurs ₹2,00,000 in monthly detention penalties - adding ₹24 Lakhs per year in direct, avoidable waste.
Beyond direct penalty invoices, gate congestion throttles factory throughput. Production lines must slow down when finished goods warehouses run out of floor space, and customer deliveries are delayed because dispatched vehicles miss evening highway green-corridor departure windows.
The 5-Stage Automated Yard Milestone Architecture
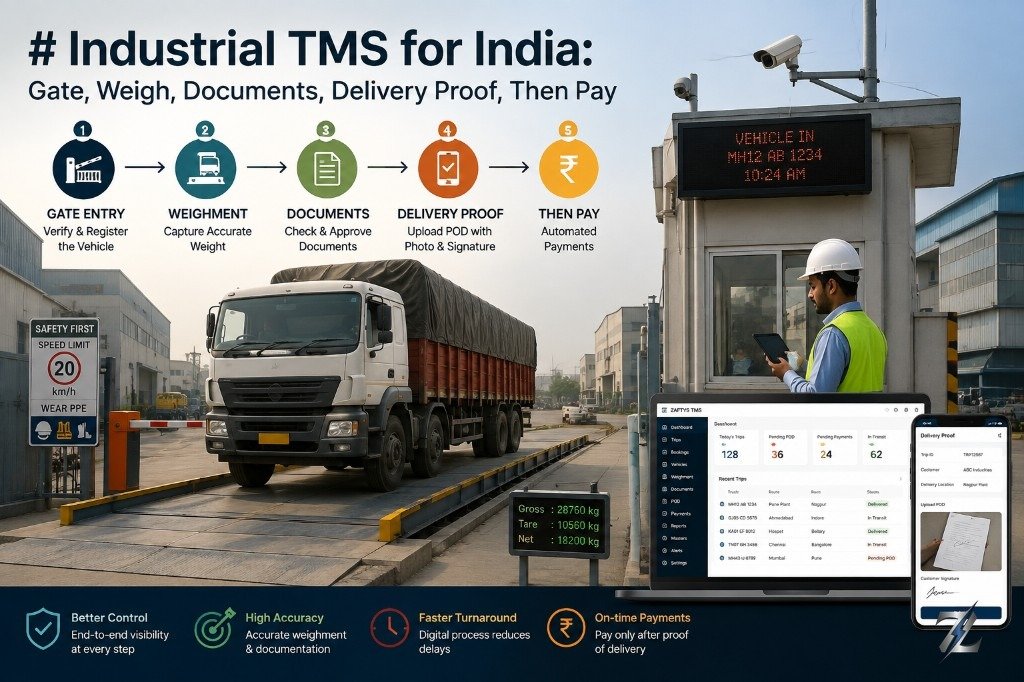
Modern enterprise logistics eliminates yard chaos by deploying an automated 5-stage milestone architecture powered by an integrated Transport Management System (TMS) and Dedicated Fleet Logistics:
1. Automated Gate Entry: High-speed Automatic Number Plate Recognition (ANPR) cameras and overhead FASTag RFID scanners identify the arriving vehicle, verify driver credentials against the open ERP Sales Order, and automatically raise the boom barrier in under 15 seconds.
2. Tare Weighment Lock: The vehicle rolls onto the weighbridge where optical infrared sensors verify platform alignment and the digital scale indicator automatically feeds unladen weight into the TMS, locking manual keyboard overrides.
3. Dynamic Bay Allocation: The TMS checks warehouse crane and labor availability, sending an automated SMS/WhatsApp alert to the driver with their assigned bay number and displaying bay directions on LED yard screens.
4. Gross Weighment & Tolerance Verification: Once loaded, the truck returns to the scale. The system calculates net payload, verifies weight against legal MoRTH safe axle ceilings and the ERP invoice quantity, and locks the gross weight record.
5. Digital Gate Exit: The system synchronizes e-Way Bill Part B details with the GST portal, issues a digital QR gate pass, and opens the exit barrier in under 2 minutes, recording the precise departure timestamp.
Chapter 03
Leak #2: Heavy-Haul Volatility and Spot Market Capacity Risks
The second major cost leak stems from volatile freight sourcing. Heavy industrial commodities cannot be transported using generic, light-duty cargo models. Transporting 30-tonne steel mother coils, dry bulk cement, hazardous liquid chemicals, or raw mining ores demands specialized equipment, certified drivers, and strict structural weight distribution.
When enterprise manufacturers rely excessively on unorganized local spot broker markets, they expose their supply chains to severe price volatility, poor vehicle placement, cargo damage, and regulatory non-compliance. During agricultural harvest seasons, major festival periods, or regional monsoons, spot market placement drops by 30% to 50%, forcing plant logistics heads to pay panic premiums of 30% to 40% above baseline freight rates just to keep production moving.
- Committed 3PL Contract Fleet (ZAFTYS) · 80%
- Flexible Digital Spot Surge (TranZfort) · 20%
Recommended fleet allocation strategy to optimize freight spend, ensure placement SLAs, and handle surge.
Placement guarantee
Dedicated 3PL contract fleet (ZAFTYS)
98% to 100% committed SLA placementUnorganized spot broker market
Volatile placement (drops 30-50% during harvest/monsoon)Rate predictability
Dedicated 3PL contract fleet (ZAFTYS)
Fixed quarterly or annual contract rate cardsUnorganized spot broker market
Subject to daily spot surges (up to 35-40% price spikes)Equipment specification
Dedicated 3PL contract fleet (ZAFTYS)
Custom trailers (coil-wells, bulkers, low-beds)Unorganized spot broker market
Generic open trucks; improper lashing and safety gearDriver qualification
Dedicated 3PL contract fleet (ZAFTYS)
Plant safety inducted, background verifiedUnorganized spot broker market
Unverified drivers; high risk of pilferage and cargo damageTechnology integration
Dedicated 3PL contract fleet (ZAFTYS)
Live TMS feeds, automated gate pass & ePODUnorganized spot broker market
Fragmented phone check-ins; zero automated status logsSupply chain risk and cost comparison for enterprise manufacturing shippers.
01
Steel & Metals
Requires flatbeds with dedicated coil wells, heavy-duty dunnage, and certified high-tensile chain lashing to prevent rolling and axle shift during high-speed transit.
02
Cement & Aggregates
Requires pneumatic cement bulkers with high-efficiency air compressors or sealed heavy tippers to prevent moisture ingress and discharge line blockages.
03
Chemicals & Liquid Cargo
Demands CCOE / PESO-certified ISO tank containers with stainless steel insulation, emergency shutoff valves, and hazmat-certified drivers with TREM cards.
04
Coal & Mining Ores
Requires heavy-duty 3-axle tipper trailers with reinforced Hardox bodies, anti-roll suspension, and dust containment tarpaulins for 24/7 mine site operations.
Heavy industrial cargo cannot be hauled on generic open trucks without severe product damage and safety risk.
Specialized Commodity Equipment Demands
Different industrial verticals require specialized rolling stock that unorganized spot brokers rarely maintain with proper safety compliance:
Steel & Metals: Heavy steel coils require flatbed trailers engineered with recessed coil-wells, heavy-duty timber dunnage, and certified high-tensile chain lashing. Loading coils onto flat wooden beds without wells leads to shifting loads, axle overloading, and catastrophic highway roll-overs. Shippers should partner with dedicated Steel Transportation Services to ensure specialized trailers.
Cement & Construction: Transporting bulk cement requires pneumatic bulkers equipped with certified air compressors for fluidised pneumatic discharge into destination silos. Substandard spot bulkers with worn discharge lines cause compressor failures, severe unloading delays, and moisture contamination. Explore Cement Logistics Solutions.
Chemicals & Hazardous Cargo: Liquid chemicals demand PESO/CCOE-certified ISO tank containers with 316L stainless steel linings, emergency shutoff valves, and drivers trained in Transport Emergency Cards (TREM cards) and HAZCHEM protocols. Explore Chemical Logistics.
Coal & Mining Ores: Mining haulage requires heavy-duty 3-axle tipper trailers with reinforced Hardox wear plates and anti-roll hydraulic tipping cylinders capable of enduring 24/7 off-road pit cycles. Explore Mining Logistics.
The 80/20 Capacity Allocation Strategy
World-class manufacturing enterprises protect their supply chains by implementing an 80/20 capacity allocation model:
80% Committed 3PL Dedicated Contract Fleets: Shippers contract dedicated vehicle capacity through managed 3PL partners like ZAFTYS Contract Logistics. This secures 98% to 100% placement guarantees, fixed quarterly or annual rate cards, plant-inducted drivers, and custom-engineered trailers.
20% Flexible Digital Spot Surge: Shippers handle seasonal volume spikes, planned plant turnarounds, and sudden month-end dispatch pushes through verified digital freight platforms like TranZfort. This provides transparent, real-time rate discovery and verified carrier documentation without paying year-round fleet holding costs on idle surge capacity.
Chapter 04
Leak #3: Highway In-Transit Blind Spots and Spoofed Telematics
Once a loaded heavy truck departs the plant gate, it enters the highway transit phase - where visibility traditionally drops to near zero. Manufacturing logistics managers are left relying on periodic phone calls to truck drivers or unverified check-ins from local transport brokers.
When consignees inquire about critical raw material or project cargo delivery status, plant desks can only offer rough estimates. In the background, unmonitored highway trucks make unauthorized roadside halts, deviate from approved industrial freight corridors, engage in diesel pilferage, or attempt illegal localized side-trips. Worse, when traffic jams or mechanical breakdowns occur, plant managers only learn of the delay when the delivery window has already been missed.
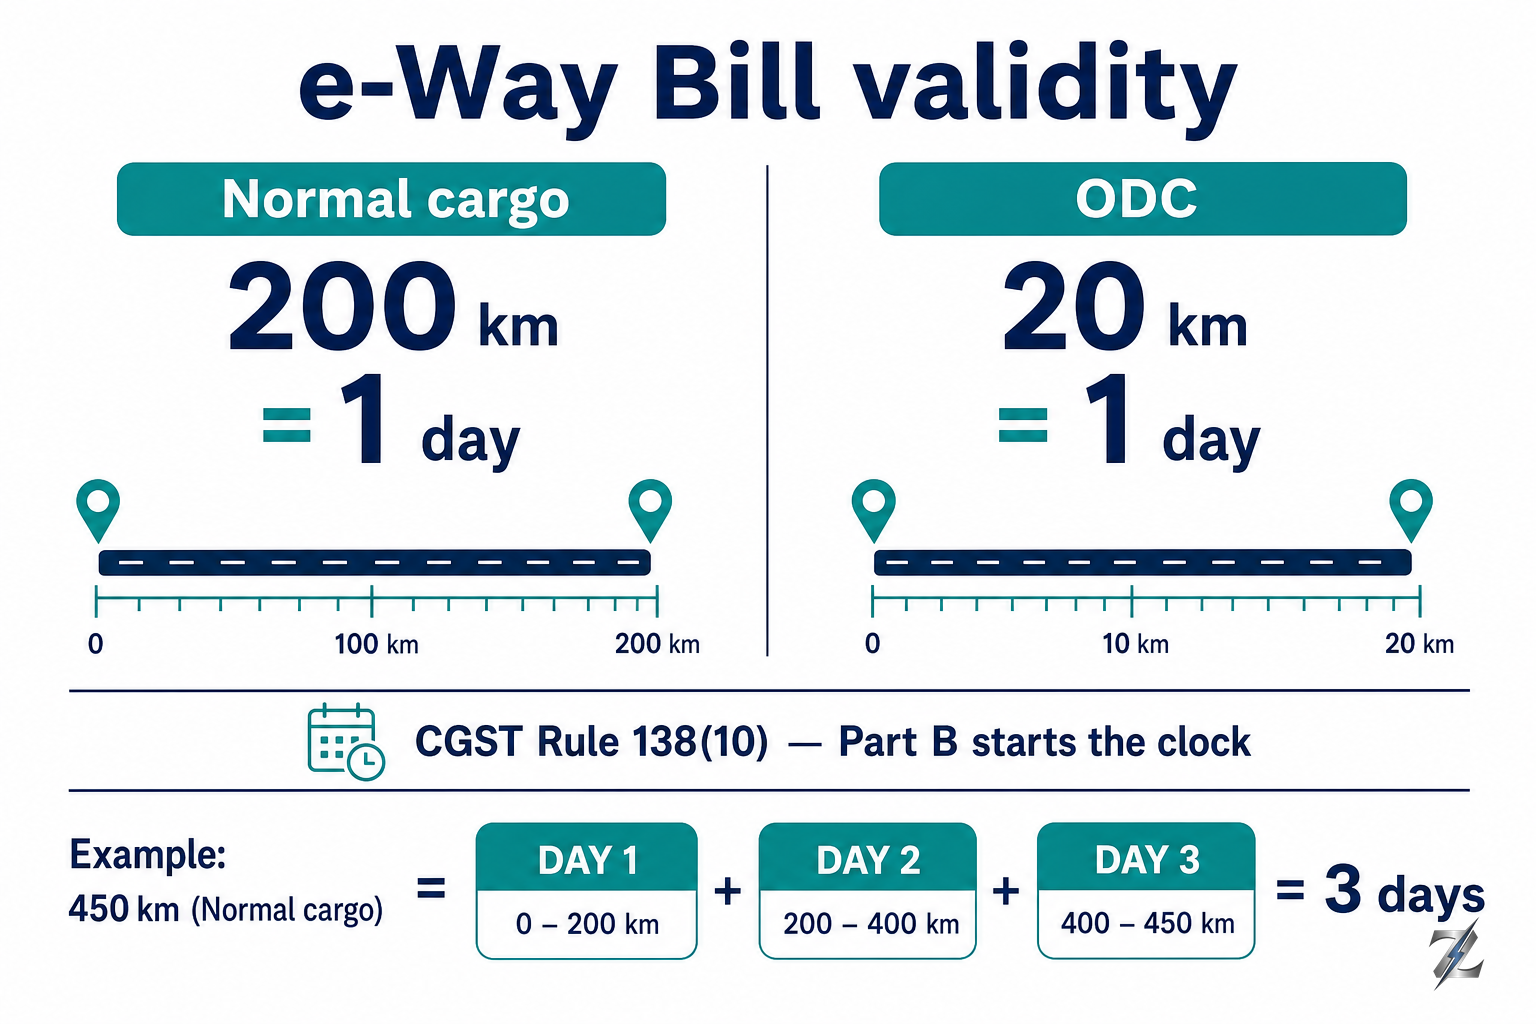
CGST Rule 138(10): 1 day validity per 200 km for regular freight; 1 day per 20 km for Over-Dimensional Cargo (ODC).
01
Layer 1: Hardwired GPS
Dedicated telematics hardware provides 60-second ping intervals, engine ignition status, speed logs, and harsh braking alerts.
02
Layer 2: FASTag NETC API
Tamper-proof toll plaza timestamps from over 650 NHAI toll booths verify highway checkpoints without hardware dependency.
03
Layer 3: SIM Triangulation
Consent-based cellular network tower pings track spot market and hired market trucks without installing any hardware.
04
Unified Visibility Engine
TMS cross-verifies all 3 feeds to calculate accurate corridor ETAs, flag unauthorized halts, and trigger route deviation alerts.
How ZAFTYS TMS combines 3 independent tracking streams into one tamper-proof freight visibility layer.
Hardwired GPS Unit
Primary use case
Dedicated 3PL & owned fleetsHardware dependency
High (wired device & OBD)FASTag NETC Toll API
Primary use case
All commercial freight (Spot & Contract)Hardware dependency
Zero (uses vehicle FASTag)SIM Cell Triangulation
Primary use case
Market hired & spot trucksHardware dependency
Zero (uses driver mobile SIM)Architecture specification for industrial freight tracking in India.
The power fuse pull
Spot drivers frequently disconnect the power fuse or unscrew battery leads to conceal unauthorized deviations, side-hauls, or illegal fuel transfers.
App-based spoofing
Smartphone tracking apps are easily tricked by mock-location apps, simulated GPS coordinate spoofers, or simple phone battery shutdowns.
The FASTag fail-safe solution
Because FASTag is read by high-power overhead toll plaza scanners across national highways, a truck cannot pass an NHAI toll plaza without creating an unalterable digital timestamp.
Real-world failure points encountered by manufacturing logistics teams.
Why Standalone GPS Devices Fail in Indian Operations
Many enterprises attempt to solve visibility by mandating hardwired GPS units on all hired trucks. In practice, standalone GPS units have a high failure rate across third-party and spot market fleets.
Drivers on market-hired trucks frequently pull the power fuse, disconnect battery leads, or place metallic shielding over GPS antennas to hide unauthorized detours or fuel siphon stops. Driver smartphone apps are equally unreliable; drivers disable mobile data, let phone batteries die, or use mock-location spoofing applications to send fake GPS coordinates while remaining stationary.
The Tri-Hybrid Tracking Engine Architecture
Modern enterprise TMS platforms resolve the tracking challenge by deploying a Tri-Hybrid Visibility Architecture that combines three independent, complementary tracking feeds into a single unified visibility layer:
Layer 1: Hardwired GPS Telematics (Dedicated Fleets). For dedicated 3PL fleets, hardwired telematics provide continuous 60-second coordinate pings, engine ignition status, real-time vehicle speed, harsh braking alerts, and fuel sensor integration.
Layer 2: FASTag NETC Toll API Integration (All Trucks). Every commercial vehicle in India carries a mandatory FASTag RFID tag. The TMS connects directly with the National Electronic Toll Collection (NETC) API across 650+ National Highway toll plazas. Every time a truck passes an overhead toll scanner, the system captures an unalterable digital record containing the toll plaza geocode, exact timestamp, vehicle class code, and direction of travel. FASTag cannot be turned off, spoofed, or disconnected by drivers.
Layer 3: Consent-Based SIM Cellular Triangulation (Spot Trucks). For market-hired trucks without dedicated hardware, the system tracks vehicles using telecom tower triangulation based on driver mobile consent. This provides regular checkpoint timestamps and geofence alerts without requiring physical hardware installation.
By cross-referencing all three data streams, the TMS calculates precise dynamic highway ETAs, triggers instant geofenced route deviation alerts, and gives supply chain directors 100% reliable visibility from plant departure to consignee delivery.
Chapter 05
Leak #4: Weighbridge Manipulation and Axle Discrepancies
In bulk and heavy manufacturing - such as cement clinker, steel coils, sponge iron, industrial aggregates, and coal - freight value is directly tied to weighbridge certified net mass. Yet, weighbridges remain one of the most vulnerable and poorly monitored cost leakages in industrial plants.
Manual scale operation, paper weigh slips, and unmonitored vehicle positioning create substantial opportunities for scale manipulation, unrecorded payload shrinkage, and illegal vehicle overloading. Minor weight discrepancies that seem negligible on a single trip compound into massive financial losses over annual production volumes.
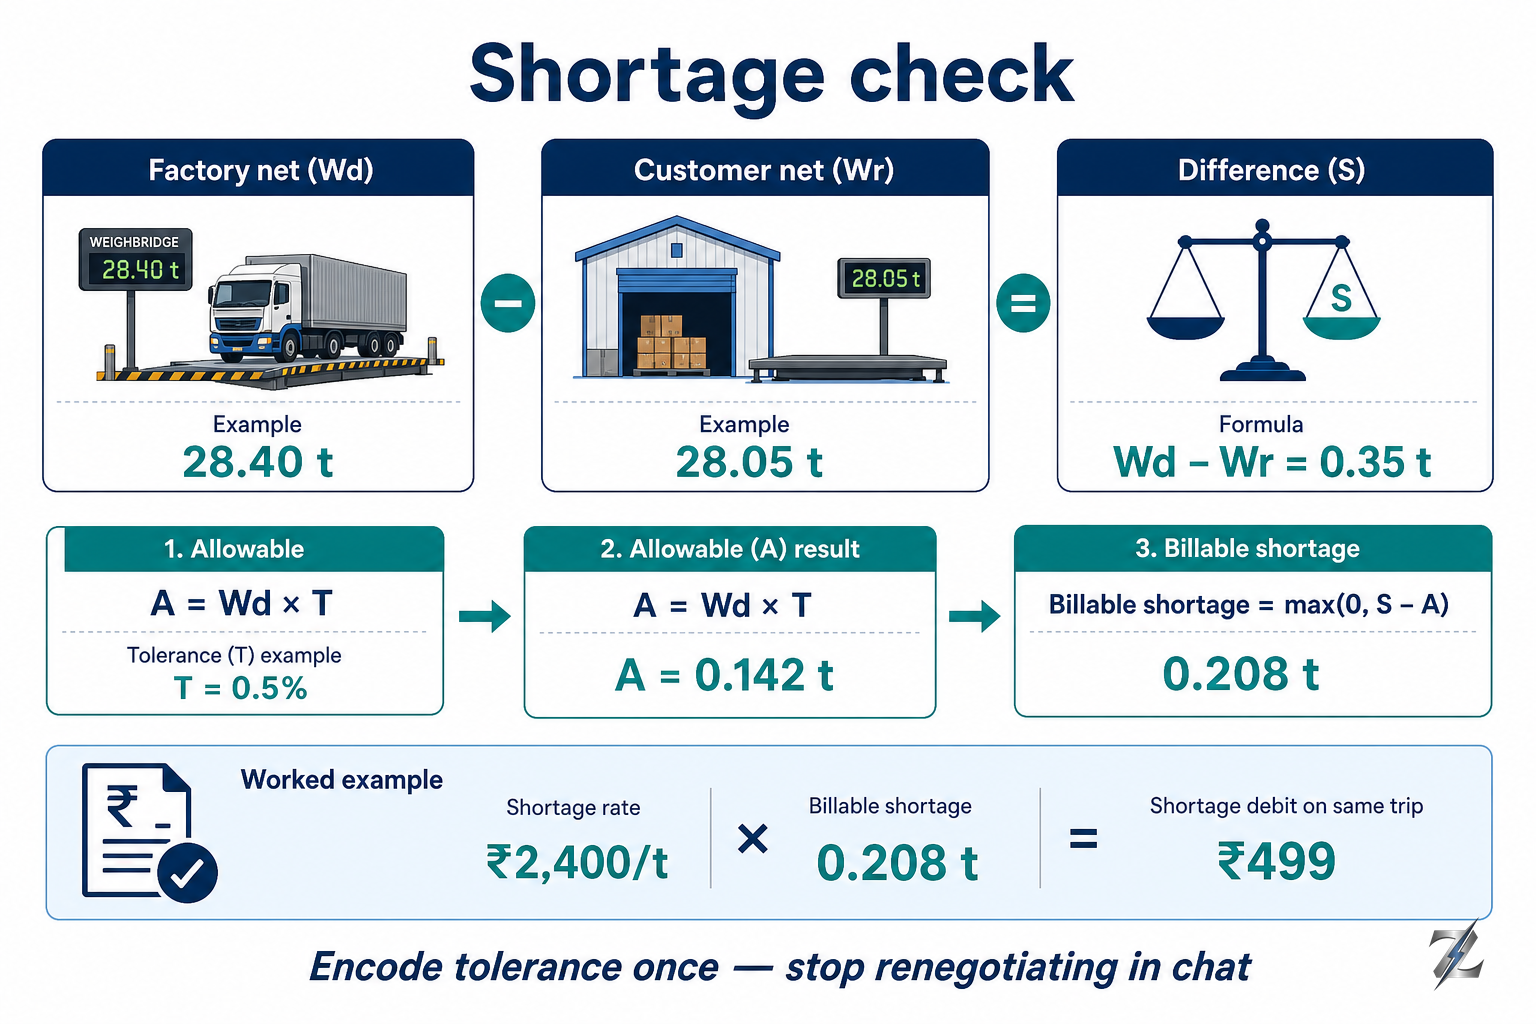
Shortage calculation: Billable Shortage = Max(0, Factory Net Weight - Customer Net Weight - Contract Tolerance).
Daily material shrinkage formula
Daily Loss (INR) = Outbound Trucks per Day * Weight Discrepancy per Truck (kg) * Material Value (INR per kg).
Cement plant financial impact calculation
A cement plant shipping 400 bulkers daily with a tiny 80 kg scale manipulation loses 32,000 kg (32 tonnes) of product every single day. At ₹5,000 per tonne, that equals ₹1,60,000 per day in stolen material, or ₹5.84 Crores per year in untracked shrinkage.
Financial loss simulation for a 400-truck-per-day industrial plant with minor scale manipulation.
- 01
1. Optical Sensor Positioning
Dual infrared optical sensors at both ends of the weigh platform verify that the vehicle is fully on the scale and not bridging the apron.
- 02
2. RS-232 Direct Serial Capture
The TMS directly queries the digital weight indicator via serial/modbus port. Manual keyboard typing is disabled in software.
- 03
3. Net Payload Calculation
The system automatically subtracts verified tare weight from gross weight to calculate certified net payload.
- 04
4. MoRTH Compliance & ERP Tolerance Check
System checks gross vehicle weight against legal axle limits (49T rigid / 55T trailer) and verifies net weight against the ERP Sales Order.
- 05
5. Interlocked Barrier Clearance
If within legal and commercial tolerance, the digital weigh slip is locked and the exit boom barrier opens. If mismatched, the barrier stays locked.
Zero-human-override hardware and software integration sequence.
Single Axle (4 tyres, standard)
Statutory maximum weight
11.5 tonnes (12.5T with air suspension)Legal tolerance margin
5% scale tolerance (Sec 113(3))Tandem Axle (8 tyres, rigid/trailer)
Statutory maximum weight
21.0 tonnesLegal tolerance margin
5% scale tolerance (Sec 113(3))Tri-Axle (12 tyres, trailer)
Statutory maximum weight
27.0 tonnesLegal tolerance margin
5% scale tolerance (Sec 113(3))Rigid Multi-Axle Vehicles Upper Cap
Statutory maximum weight
49.0 tonnes Gross Vehicle Weight (GVW)Legal tolerance margin
5% scale tolerance (Sec 113(3))Semi-Articulated / Tractor-Trailer Cap
Statutory maximum weight
55.0 tonnes Gross Combination WeightLegal tolerance margin
5% scale tolerance (Sec 113(3))Motor Vehicles Act Section 113, 194 and MoRTH Gazette Notification S.O. 3467(E).
The Multi-Crore Mathematics of Scale Shrinkage
The financial drain of weighbridge manipulation can be calculated using the formula: Daily Material Loss (INR) = Daily Outbound Trucks * Weight Discrepancy per Truck (kg) * Material Value (INR per kg).
Consider a modern cement manufacturing facility shipping 400 bulker loads per day. If manual weighbridge typing or improper scale calibration allows an average discrepancy of just 80 kg per truckload (less than 0.25% of a 35-tonne payload), the plant leaks 32,000 kg (32 tonnes) of finished cement every day.
At an average market value of ₹5,000 per tonne, that 80 kg discrepancy drains ₹1,60,000 per day in unbilled product - bleeding ₹5.84 Crores per year in untracked shrinkage from a single facility.
MoRTH Safe Axle Load Ceilings and Statutory Enforcement
Weighbridge control is also a critical statutory compliance obligation. Under MoRTH Gazette Notification S.O. 3467(E) and Section 113 of the Motor Vehicles Act, India mandates strict safe axle load limits:
Single Axle (4 tyres): Maximum 11.5 tonnes (12.5 tonnes if equipped with pneumatic air suspension).
Tandem Axle (8 tyres): Maximum 21.0 tonnes.
Tri-Axle (12 tyres): Maximum 27.0 tonnes.
Rigid Multi-Axle Trucks Upper Cap: Maximum 49.0 tonnes Gross Vehicle Weight (GVW).
Semi-Articulated Tractor-Trailers Upper Cap: Maximum 55.0 tonnes Gross Combination Weight (GCW).
While Section 113(3) provides a 5% tolerance margin for scale variation and moisture fluctuation, Supreme Court directives mandate that any vehicle overloaded by more than 10% above legal GVW must undergo mandatory roadside offloading of excess cargo, in addition to steep compounding fines under Section 194. A single overloaded truck halted by highway enforcement risks cargo impoundment, missed customer delivery windows, and severe financial liability. Learn more in our comprehensive Axle Load and GVW Limits Guide.
Zero-Override Weighbridge Interlocking Protocol
To eliminate scale fraud and guarantee statutory compliance, modern plants implement automated weighbridge interlocking:
1. Dual Optical Beams: Infrared positioning sensors at both ends of the scale platform confirm the truck is fully on the scale, preventing drivers from bridging scale edges to falsify tare weight.
2. Direct RS-232 / Modbus Serial Capture: The TMS connects directly to the digital weight indicator via serial communication. Manual keyboard typing is disabled in software, making it impossible for operators to key in false numbers.
3. Automated Tolerance Verification: The system automatically calculates Net Payload (Gross Weight minus Tare Weight) and cross-checks the figure against the ERP Sales Order quantity and MoRTH axle limits.
4. Interlocked Barrier Clearance: If the payload is within legal and commercial tolerance (e.g. ±0.5%), the system locks the certified weigh record and opens the gate barrier. If mismatched or overloaded, the barrier remains locked and alerts plant security.
Chapter 06
Leak #5: Delayed e-PODs and Working Capital Lockup
The fifth and final cost leak occurs at the commercial reconciliation stage. In traditional Indian logistics, freight settlement depends on physical paper Lorry Receipts (LRs) carrying stamped consignee acknowledgements. These paper documents travel by physical postal courier from remote construction projects, mining sites, or regional distribution hubs back to corporate headquarters.
The physical LR courier cycle routinely takes 30 to 60 days. While paper documents crawl through transit, freight invoices sit unverified in processing queues. Transporters wait weeks for freight payments, finance teams struggle to reconcile detention and shortage claims, and working capital remains locked in unclosed billing registers.
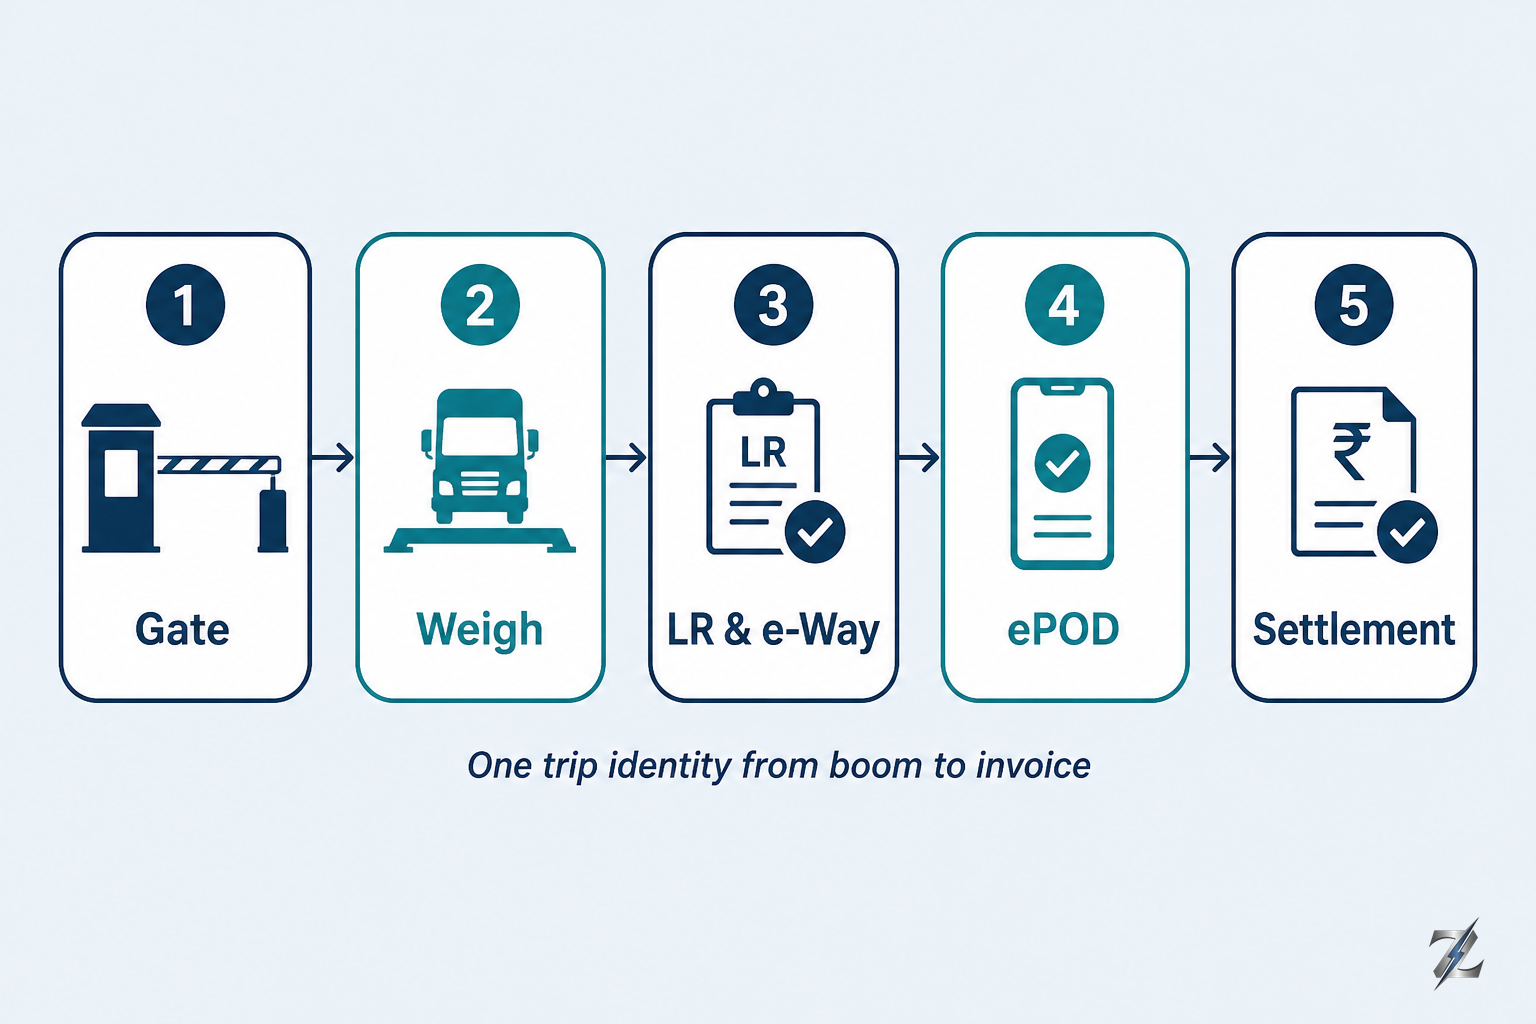
Gate Identity → Locked Weighbridge → Documents & e-Way → Digital Delivery Proof (ePOD) → Four-Way Settlement.
01
1. ERP Purchase Order
Contract freight rate, lane origin/destination, and agreed fuel escalation formula.
02
2. Automated Gate Timestamps
Verified entry, tare weigh, gross weigh, and exit timestamps to audit detention claims.
03
3. Locked Weighbridge Slip
Tamper-proof certified scale net weight matching dispatch invoice quantity.
04
4. Geo-Stamped Digital ePOD
Consignee signed delivery copy with GPS geofence validation and shortage notes.
05
Automated Payment Approval
If all 4 match within tolerance, invoice is passed for payment in 48 hours without human friction.
How automated matching replaces 45-day paper freight audit cycles.
POD return timeline
Traditional physical paper LR process
30 to 60 days via physical courier from remote sitesDigital ePOD 4-Way automated matching
Instant digital upload within 2 hours of deliveryInvoice audit cycle
Traditional physical paper LR process
15 to 30 days of manual spreadsheet reconciliationDigital ePOD 4-Way automated matching
Automated system audit completed in under 48 hoursShortage / damage disputes
Traditional physical paper LR process
Endless phone arguments between transporter and plantDigital ePOD 4-Way automated matching
Visual photo proof & receiver notes locked at deliveryDetention billing verification
Traditional physical paper LR process
Transporter claims manual hours; zero proofDigital ePOD 4-Way automated matching
Automated gate in/out timestamps cross-checked instantlyTransporter cash flow
Traditional physical paper LR process
Delayed payments lead to carrier refusal during peaksDigital ePOD 4-Way automated matching
Fast payment cycles secure top-tier carrier loyaltyOperational timeline and working capital comparison.
01
High-Resolution Signed LR Photo
Clear photographic capture of the physical consignee acknowledgement stamp and authorized receiver signature.
02
GPS Geofenced Coordinate Check
Digital timestamp and latitude/longitude coordinates verified within a 50-meter radius of the customer unloading point.
03
Delivery Timestamp Validation
Automated verification that delivery occurred during authorized customer site operating and receiving hours.
04
Structured Exception Recording
Categorized recording of any carton shortage, bag burst, moisture damage, or customer unloading detention hours.
05
Customer OTP / Digital Acknowledgment
Secure one-time password verification sent to the authorized consignee store manager for instant delivery validation.
Required digital artifacts captured via driver mobile link or transporter app.
The 4-Way Automated Invoice Reconciliation Engine
Modern enterprise TMS platforms eliminate paper audit delays by replacing manual spreadsheet checking with an automated 4-Way Reconciliation Engine that matches four objective digital data sources before releasing payment:
1. ERP Purchase Order: Confirms agreed contractual freight rates, lane origin/destination, and the approved fuel price variation clause.
2. Automated Gate Timestamps: Ingests FASTag and ANPR gate entry and exit timestamps to audit and validate transporter detention claims down to the exact minute.
3. Certified Weighbridge Record: Verifies the tamper-proof scale net weight to validate billed tonnage and prevent payload inflation.
4. Geo-Stamped Digital ePOD: Captures high-resolution consignee-signed delivery documentation, verified by GPS geofencing and customer OTP.
When all four data points match within pre-configured enterprise tolerances, the TMS automatically approves the invoice and posts the accounting entry to the ERP ledger in under 48 hours. If an exception occurs (such as customer-noted material damage or unverified detention hours), the system routes only the disputed variance to human audit, clearing 85%+ of standard bills automatically.
e-Way Bill Compliance and Part B Timing
A critical component of modern freight settlement is maintaining strict GST e-Way Bill compliance. Under CGST Rule 138(10), regular cargo receives 1 day of validity for every 200 km (or part thereof), while Over-Dimensional Cargo (ODC) receives 1 day for every 20 km.
Operating an unmonitored fleet frequently leads to expired e-Way Bills when vehicles encounter unexpected highway delays. Under GST laws, transporting goods with an expired e-Way Bill triggers penalties equal to 100% of the applicable tax value (or 200% under Section 129). Enterprise TMS platforms continuously monitor e-Way Bill validity against live vehicle GPS/FASTag progress, alerting dispatchers 8 hours before expiry to trigger timely legal extensions. Read our detailed guide on ePOD, FASTag, and e-Way Bill Compliance.
Chapter 07
The Master 25-Point Industrial Freight Scorecard
Eliminating the 5 hidden cost leaks requires a systematic, objective assessment of your current logistics infrastructure. Supply chain directors, plant heads, and CFOs can use the 25-Point Industrial Freight Audit Matrix below to evaluate their operations across Yard Control, Fleet Procurement, Highway Visibility, Weighbridge Integrity, and Financial Settlement.
Review each criterion with your plant operations, transport procurement, and finance teams. Grade each item from 1 (entirely manual / weak) to 5 (fully automated / proven live in TMS).
Gate and masters
Weight 25%·Lines 1-5
- 1
Are plant gate entry and exit timestamps captured automatically via FASTag / ANPR cameras without manual logbooks?
- 2
Does your yard system track free-time hours automatically and alert supervisors before detention penalties kick in?
- 3
Are truck drivers assigned specific loading/unloading bays via automated SMS or WhatsApp alerts with zero yard wandering?
- 4
Is average total plant Turnaround Time (TAT) maintained under 120 minutes from outer gate entry to exit?
- 5
Is truck arrival dynamically synchronized with daily ERP production schedules and warehouse bay capacity?
Contract sourcing
Weight 25%·Lines 6-10
- 6
Is at least 75% to 80% of your freight volume covered by SLA-managed dedicated 3PL contract fleets?
- 7
Do your transport contracts include clear, enforceable SLA penalties for placement failures and transit delays?
- 8
Can your logistics team secure specialized equipment (bulkers, coil flatbeds, tankers) within 4 hours during peak surges?
- 9
Is every spot market truck automatically vetted for driver license, RC, national permit, and insurance validity?
- 10
Are backhaul return loads systematically analyzed and matched to reduce round-trip freight costs?
Transit visibility
Weight 20%·Lines 11-15
- 11
Does your in-transit visibility system combine hardwired GPS, FASTag toll logs, and cellular SIM triangulation?
- 12
Are automated alerts generated if a vehicle deviates from approved industrial transit corridors or makes unauthorized halts?
- 13
Is dynamic customer delivery ETA recalculated and updated automatically every 60 minutes?
- 14
Are high-risk highway corridors and state borders monitored using automated geofenced checkpoints?
- 15
Can your team track hired market trucks in real time without requiring physical hardware installation?
Weighbridge
Weight 25%·Lines 16-20
- 16
Are plant weighbridge scale indicators interlocked directly with your TMS software via serial/modbus port?
- 17
Is manual keyboard weight typing completely disabled for weighbridge operators across all plant shifts?
- 18
Does your system verify vehicle gross loads against statutory MoRTH safe axle weight limits before gate exit?
- 19
Are weight variances exceeding 0.5% between Sales Order and Scale Net automatically flagged for security audit?
- 20
Is vehicle tare (unladen) weight verified and locked on every single entry before bay loading?
Finance and ERP
Weight 20%·Lines 21-25
- 21
Are digital ePODs captured and uploaded into the system within 2 hours of customer delivery?
- 22
Is freight invoice auditing fully automated using a 4-Way match (PO rate + Gate time + Scale net + ePOD)?
- 23
Is e-Way Bill validity monitored in real time with automated alerts before the legal transit window expires?
- 24
Are detention invoices automatically cross-checked against system gate timestamps before payment approval?
- 25
Is the complete freight billing and reconciliation cycle completed in under 48 hours from delivery?
Tap 1 (weak / manual) to 5 (automated / live). Use in management reviews with plant heads, procurement, and logistics directors.
Evaluating Your Audit Score
20 to 25 Points: World-Class Freight Operations. Your logistics infrastructure operates with high automation, strict weight compliance, and low leakage (<1% of total freight spend). Your focus should be on fine-tuning backhaul matching and expanding automated vendor analytics.
12 to 19 Points: Moderate Operational Leakage. Your organization experiences significant hidden losses, estimated between 5% and 8% of total logistics spend. Primary leakages typically concentrate in gate detention overruns, unmonitored highway blind spots, and 30-day paper POD audit cycles.
0 to 11 Points: High Operational Risk. Severe cost leakage exceeding 10% of gross logistics spend. Your supply chain suffers from manual gate queues, uncalibrated weighbridge shrinkage, spot market price volatility, and high carrier dispute rates. Immediate modernization using ZAFTYS Contract Logistics and ZAFTYS TMS is recommended.
The Implementation Roadmap: 90 Days to Full Control
Transforming industrial logistics does not require shutting down plant operations. Shippers should follow a proven, phased 90-day implementation roadmap:
Month 1 - Baseline & Yard Control: Implement FASTag gate scanning, disable manual weighbridge typing, and establish clean 90-day baseline metrics for gate TAT, scale variance, and detention spend.
Month 2 - Capacity & In-Transit Visibility: Transition 80% of core lane volume to dedicated 3PL contract capacity with strict placement SLAs, and activate Tri-Hybrid tracking (GPS + FASTag + SIM) across all outbound corridors.
Month 3 - Automated Financial Settlement: Deploy digital ePOD capture across receiver networks, activate the 4-Way automated invoice reconciliation engine, and cut freight billing turnaround from 45 days to 48 hours.
To start your plant logistics audit and explore dedicated contract fleets, connect with ZAFTYS Operations or explore our Logistics Services.
Appendix
Frequently asked questions
What is the Total Cost of Logistics (TCL) in heavy manufacturing?
Total Cost of Logistics (TCL) represents the true landed cost of moving industrial freight. It combines base freight rates with plant gate detention charges, weighbridge variance and material shrinkage, in-transit working capital holding interest, and billing overcharges or audit discrepancies. In Indian manufacturing, base freight rates represent only 30% to 40% of TCL.
How do plant gate queues create hidden logistics costs?
When trucks wait 4 to 8 hours at plant gates due to manual paper registers and uncoordinated bay loading, standard transport contracts trigger detention billing after the 2 to 4 hour free-time window. At standard commercial rates of ₹500 to ₹1,000 per hour per heavy vehicle, a plant with 200 outbound trips and a 2-hour delay incurs ₹2,00,000 monthly in pure penalty waste.
Why do standalone GPS devices fail on Indian freight corridors?
Standalone hardwired GPS units on spot market or third-party trucks fail because drivers frequently pull power fuses, unscrew antenna leads, or experience device malfunctions during transit. Smartphone driver apps are equally vulnerable to mock-location spoofing or dead phone batteries. A tri-hybrid tracking engine pairing GPS with tamper-proof FASTag NETC toll logs and cellular SIM triangulation eliminates blind spots.
How does an automated weighbridge interlock prevent material fraud?
An automated weighbridge interlock connects digital weight indicators directly to the TMS via RS-232 serial or Modbus communication while disabling manual keyboard weight typing in software. Optical infrared beams verify vehicle alignment on the platform, and the system automatically checks payload weight against ERP Sales Orders and statutory MoRTH axle limits before releasing the exit barrier.
What are the MoRTH safe axle load limits under Indian law?
Under MoRTH Gazette S.O. 3467(E) and Section 113 of the Motor Vehicles Act, maximum legal axle weights are 11.5 tonnes for standard single axles (12.5 tonnes with pneumatic air suspension), 21.0 tonnes for tandem axles, and 27.0 tonnes for tri-axles. Rigid multi-axle trucks are capped at 49.0 tonnes GVW, while semi-articulated tractor-trailers are capped at 55.0 tonnes GCW.
What is the statutory scale tolerance under Motor Vehicles Act Section 113(3)?
Section 113(3) of the Motor Vehicles Act provides a 5% statutory tolerance margin to account for scale calibration differences and moisture variation. However, under Supreme Court directives, any vehicle loaded more than 10% above its legal Gross Vehicle Weight must be halted for mandatory roadside offloading of excess cargo, in addition to heavy financial penalties under Section 194.
What is a 4-Way automated freight invoice audit?
A 4-Way automated audit reconciles four independent data points before approving transporter payment: (1) ERP Purchase Order rate card and fuel formula, (2) Automated gate-in and gate-out timestamps to verify detention, (3) Locked weighbridge certified net weight slip, and (4) Geo-stamped digital ePOD with consignee signature. If all four match within tolerance, payment is approved in under 48 hours.
How does digital ePOD replace physical paper Lorry Receipts (LR)?
Traditional physical paper L₹take 30 to 60 days to return by courier from remote mining or construction sites to corporate accounts desks, delaying invoice clearance. Digital ePOD allows drivers or receivers to capture a high-resolution photo of the signed LR, validated by GPS geofencing (within 50 meters of the delivery site) and receiver OTP, uploading certified proof within 2 hours of delivery.
What is the 80/20 capacity allocation model for industrial shippers?
The 80/20 model allocates 75% to 85% of baseline industrial freight volume to committed 3PL dedicated contract fleets with guaranteed placement SLAs and stable quarterly pricing. The remaining 15% to 25% is handled via verified digital freight networks (like TranZfort) to absorb seasonal surges, plant shutdowns, and month-end dispatch peaks without paying year-round fleet holding costs.
What are the e-Way Bill validity distance rules under GST?
Under CGST Rule 138(10), regular commercial freight receives 1 day of e-Way Bill validity for every 200 km (or part thereof). For Over-Dimensional Cargo (ODC) or multimodal movements involving ship/rail, the validity is 1 day for every 20 km. Updating Part B (vehicle registration number) before gate-out is mandatory to maintain legal validity during highway transit.
How does in-transit delay increase working capital costs?
In-transit inventory ties up working capital. Using the holding cost formula: Daily Cost = Consignment Value * (WACC % / 365) * Delay Days. For high-value shipments like steel coils or industrial equipment valued at ₹5 Crores with a 12% WACC, an unmonitored 4-day transit delay adds ₹65,752 in pure interest drag on a single truckload.
Why do bulk commodities like cement and coal require specialized trailers?
Bulk commodities cannot be hauled safely in general open trucks. Cement requires sealed pneumatic bulkers with specialized air compressors to prevent moisture solidification and discharge clogging. Coal and mining ores require heavy-duty 3-axle tippers with Hardox steel lining and roll-stability systems to handle abrasive loading and 24/7 off-road haulage.
How does ZAFTYS TMS manage carrier detention claims?
ZAFTYS TMS captures automated gate entry and exit timestamps via FASTag readers and ANPR cameras. The system automatically tracks contractual free-time hours (e.g., 3 hours) and calculates valid detention down to the exact minute. Transporters cannot submit inflated verbal detention bills because every claim is cross-checked against objective system timestamps.
Can an enterprise TMS integrate with existing ERP systems like SAP?
Yes. Modern enterprise TMS platforms connect with SAP S/4HANA, SAP ECC, Oracle, and custom ERP systems via REST APIs. The TMS ingests daily dispatch indents, Sales Orders, and Purchase Orders, returning real-time gate milestones, locked weighbridge net weights, digital ePOD links, and certified freight invoices for automated ledger posting.
What steps should a plant take to eliminate weighbridge shrinkage?
Plants should implement a three-step protocol: (1) Install optical position sensors at scale boundaries to prevent wheel-bridging, (2) Direct-wire digital indicators to the TMS via serial ports while locking manual keyboard input, and (3) Require tare weighment before bay entry and gross weighment before gate pass generation, flagging any variance over 0.5% for supervisor review.
Sources
References and data sources
Public sources below are for orientation. They are not ZAFTYS audited financials. Read the originals before a number goes into a board pack.
- [1]National Logistics Policy (NLP) and NITI Aayog: Framework for reducing national logistics costs to 8% - 9% of GDP.
- [2]Ministry of Road Transport and Highways (MoRTH): S.O. 3467(E) and S.O. 4353(E) on safe axle loading, gross vehicle weight (GVW), and gross combination weight (GCW) limits.
- [3]Motor Vehicles Act, 1988: Section 113 (Weight limits) and Section 194 (Overloading penalties and mandatory offloading directives).
- [4]National Payments Corporation of India (NPCI) / NHAI / IHMCL: National Electronic Toll Collection (NETC) FASTag API specifications and toll plaza geocode data.
- [5]Central Goods and Services Tax (CGST) Rules, 2017: Rule 138, 138(10) on e-Way Bill distance validity (200 km regular / 20 km ODC) and Part A / Part B compliance.
- [6]Legal Metrology (General) Rules, 2011 and OIML R76 Class III standards for industrial weighbridge digital indicators and scale calibration.
- [7]Indian Institute of Management Ahmedabad (IIMA) and CRISIL Research: Operational benchmarks on commercial vehicle turnaround time, idle standing costs, and road freight diesel sensitivity.
- [8]ZAFTYS Industrial Operations Data: Aggregated trip, gate, weighbridge, and freight settlement metrics across heavy industrial manufacturing corridors, 2024 - 2026.
Related reading